Thomas C Smits, Nikolay Akhmetov, Tiffany S Liaw, Mark S Keller, Eric Moerth, Nils Gehlenborg (2026). scellop: A Scalable Redesign of Cell Population Plots for Single-Cell Data. Bioinformatics Advances, vbag083. https://doi.org/10.1093/bioadv/vbag083
@article{smits2026scellop,
author = {Smits, Thomas C and Akhmetov, Nikolay and Liaw, Tiffany S and Keller, Mark S and Mörth, Eric and Gehlenborg, Nils},
title = {scellop: A Scalable Redesign of Cell Population Plots for Single-Cell Data},
journal = {Bioinformatics Advances},
pages = {vbag083},
year = {2026},
month = {03},
issn = {2635-0041},
doi = {10.1093/bioadv/vbag083},
url = {https://doi.org/10.1093/bioadv/vbag083},
}
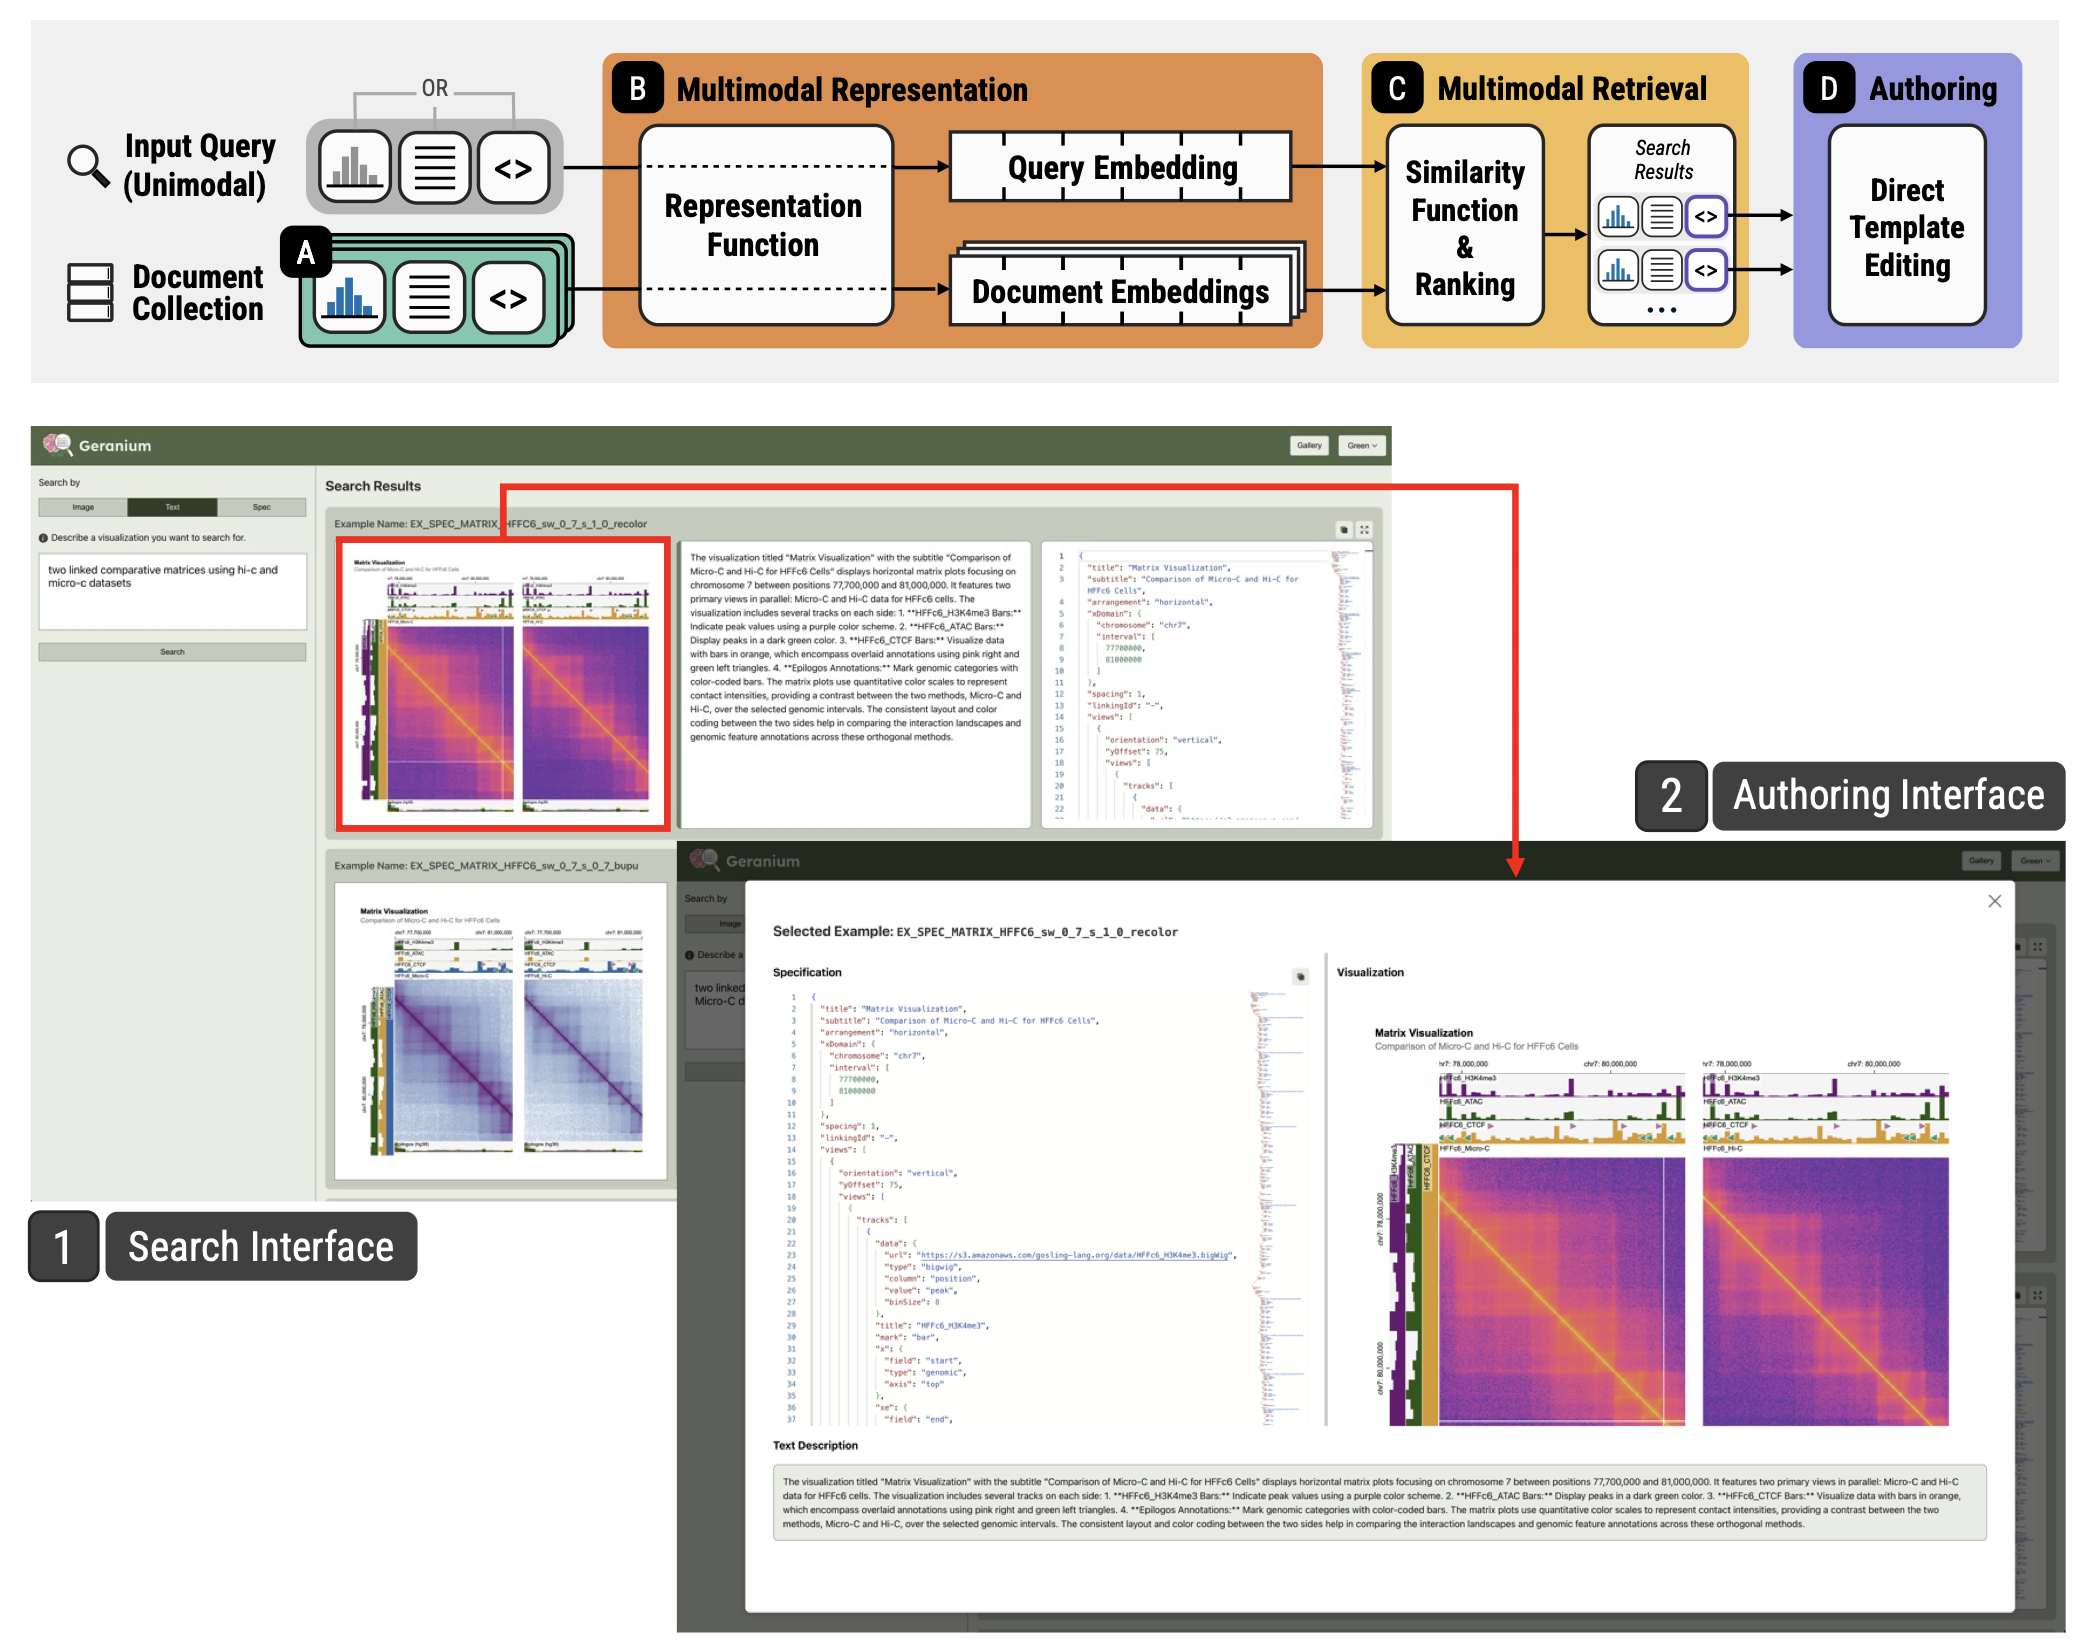
Geranium: Multimodal Retrieval of Genomics Data Visualizations
Huyen N Nguyen,
Sehi L'Yi,
Thomas C Smits,
Shanghua Gao,
Marinka Zitnik,
Nils Gehlenborg
Huyen N Nguyen, Sehi L’Yi, Thomas C Smits, Shanghua Gao, Marinka Zitnik, Nils Gehlenborg (2025). Geranium: Multimodal Retrieval of Genomics Data Visualizations. IEEE Transactions on Visualization and Computer Graphics. 10.1109/TVCG.2026.3683429
@misc{nguyen2025geranium,
title={Geranium: Multimodal Retrieval of Genomics Data Visualizations},
author={Nguyen, Huyen N and L'Yi, Sehi and Smits, Thomas C and Gao, Shanghua and Zitnik, Marinka and Gehlenborg, Nils},
year={2026},
volume={},
number={},
journal={IEEE Transactions on Visualization and Computer Graphics},
url={osf.io/zatw9_v1},
doi={10.1109/TVCG.2026.3683429},
}
2025
HuBMAP Data Portal: A Resource for Multi-Modal Spatial and Single-Cell Data of Healthy Human Tissues
Morgan L Turner,
Thomas C Smits,
Tiffany S Liaw,
Brendan Honick,
Bill Shirey,
Lisa Choy,
Nikolay Akhmetov,
Shaokun An,
David Betancur,
Dominic Bordelon,
Karl Burke,
Ivan Cao-Berg,
John Conroy,
Chris Csonka,
Penny Cuda,
Sean Donahue,
Stephen Fisher,
Derek Furst,
Ed Hanna,
Josef Hardi,
Tabassum Kakar,
Mark S Keller,
Xiang Li,
Yan Ma,
Allison McWilliams,
Austen Money,
Richard Morgan,
Eric Moerth,
Juan Muerto,
Mark A Musen,
Emily Nic,
Martin J O'Connor,
Gesina Phillips,
Alex Ropelewski,
Ryan Sablosky,
Sravani Saripalli,
Max Sibilla,
Derek Simmel,
Alan Simmons,
Xu Tang,
Joel Welling,
Zhou Yuan,
Martin Hemberg,
Matt Ruffalo,
Jonathan Silverstein,
Philip Blood,
Nils Gehlenborg
Morgan L Turner, Thomas C Smits, Tiffany S Liaw, Brendan Honick, Bill Shirey, Lisa Choy, Nikolay Akhmetov, Shaokun An, David Betancur, Dominic Bordelon, Karl Burke, Ivan Cao-Berg, John Conroy, Chris Csonka, Penny Cuda, Sean Donahue, Stephen Fisher, Derek Furst, Ed Hanna, Josef Hardi, Tabassum Kakar, Mark S Keller, Xiang Li, Yan Ma, Allison McWilliams, Austen Money, Richard Morgan, Eric Moerth, Juan Muerto, Mark A Musen, Emily Nic, Martin J O’Connor, Gesina Phillips, Alex Ropelewski, Ryan Sablosky, Sravani Saripalli, Max Sibilla, Derek Simmel, Alan Simmons, Xu Tang, Joel Welling, Zhou Yuan, Martin Hemberg, Matt Ruffalo, Jonathan Silverstein, Philip Blood, Nils Gehlenborg (2025). HuBMAP Data Portal: A Resource for Multi-Modal Spatial and Single-Cell Data of Healthy Human Tissues (under review). arXiv. 10.48550/arXiv.2511.05708
@misc{turner2025hubmapdataportal,
title={HuBMAP Data Portal: A Resource for Multi-Modal Spatial and Single-Cell Data of Healthy Human Tissues},
author={Morgan L. Turner and Thomas C. Smits and Tiffany S. Liaw and Brendan Honick and Bill Shirey and Lisa Choy and Nikolay Akhmetov and Shaokun An and David Betancur and Dominic Bordelon and Karl Burke and Ivan Cao-Berg and John Conroy and Chris Csonka and Penny Cuda and Sean Donahue and Stephen Fisher and Derek Furst and Ed Hanna and Josef Hardi and Tabassum Kakar and Mark S. Keller and Xiang Li and Yan Ma and Allison McWilliams and Austen Money and Richard Morgan and Eric Moerth and Juan Muerto and Mark A. Musen and Emily Nic and Martin J. O'Connor and Gesina Phillips and Alex Ropelewski and Ryan Sablosky and Sravani Saripalli and Max Sibilla and Derek Simmel and Alan Simmons and Xu Tang and Joel Welling and Zhou Yuan and Martin Hemberg and Matt Ruffalo and Jonathan Silverstein and Philip Blood and Nils Gehlenborg},
year={2025},
eprint={2511.05708},
archivePrefix={arXiv},
primaryClass={q-bio.QM},
url={https://arxiv.org/abs/2511.05708},
doi={10.48550/arXiv.2511.05708},
}
GQVis: A Dataset of Genomics Data Questions and Visualizations for Generative AI
Skylar Sargent Walters,
Arthea Valderrama,
Thomas C Smits,
David Kouřil,
Huyen N Nguyen,
Sehi L'Yi,
Devin Lange,
Nils Gehlenborg
IEEE 2025 1st Workshop on GenAI, Agents, and the Future of VIS (VIS x GenAI)
Skylar Sargent Walters, Arthea Valderrama, Thomas C Smits, David Kouřil, Huyen N Nguyen, Sehi L’Yi, Devin Lange, Nils Gehlenborg (2025). GQVis: A Dataset of Genomics Data Questions and Visualizations for Generative AI. IEEE 2025 1st Workshop on GenAI, Agents, and the Future of VIS (VIS x GenAI). 10.48550/arXiv.2510.13816
@inproceedings{walters2025gqvis,
title={GQVis: A Dataset of Genomics Data Questions and Visualizations for Generative AI},
author={Walters, Skylar Sargent and Valderrama, Arthea and Smits, Thomas C. and Kouřil, David and Nguyen, Huyen N. and L'Yi, Sehi and Lange, Devin and Gehlenborg, Nils},
publisher={VIS x GenAI @ IEEE VIS 2025},
year={2025},
month={Jul},
doi={10.48550/arXiv.2510.13816},
}
Ten Simple Rules for Making Biomedical Data Resources Accessible
Thomas C Smits,
Lawrence Weru,
Sehi L'Yi,
Nils Gehlenborg
Thomas C Smits, Lawrence Weru, Sehi L’Yi, Nils Gehlenborg (2025). Ten Simple Rules for Making Biomedical Data Resources Accessible. PLoS Computational Biology 21(11): e1013657. 10.1371/journal.pcbi.1013657
@article{smits2025tensimplerules,
doi = {10.1371/journal.pcbi.1013657},
author = {Smits, Thomas C. AND Weru, Lawrence AND Gehlenborg, Nils AND L’Yi, Sehi},
journal = {PLOS Computational Biology},
publisher = {Public Library of Science},
title = {Ten simple rules for making biomedical data resources accessible},
year = {2025},
month = {11},
volume = {21},
url = {https://doi.org/10.1371/journal.pcbi.1013657},
pages = {1-9},
abstract = {null},
number = {11},
}
A comprehensive evaluation of life sciences data resources reveals significant accessibility barriers
Sehi L’Yi,
Harrison G Zhang,
Andrew P Mar,
Thomas C Smits,
Lawrence Weru,
Sofía Rojas,
Alexander Lex,
Nils Gehlenborg
Sehi L’Yi, Harrison G Zhang, Andrew P Mar, Thomas C Smits, Lawrence Weru, Sofía Rojas, Alexander Lex, Nils Gehlenborg (2025). A comprehensive evaluation of life sciences data resources reveals significant accessibility barriers. Scientific Reports, 15, 23676. 10.1038/s41598-025-08731-7
@article{lyi2025accessibilityanalysis,
title = {A Comprehensive Evaluation of Life Sciences Data Resources Reveals Significant Accessibility Barriers},
author = {L'Yi, Sehi and Zhang, Harrison G. and Mar, Andrew P. and Smits, Thomas C. and Weru, Lawrence and Rojas, Sof{\'i}a and Lex, Alexander and Gehlenborg, Nils},
year = 2025,
month = jul,
journal = {Scientific Reports},
volume = {15},
number = {1},
pages = {23676},
issn = {2045-2322},
doi = {10.1038/s41598-025-08731-7},
url = {https://doi.org/10.1038/s41598-025-08731-7},
}
The State of Single-Cell Atlas Data Visualization in the Biological Literature
Mark S Keller,
Eric Moerth,
Thomas C Smits,
Simon Warchol,
Qianwen Wang,
Robert Krueger,
Hanspeter Pfister,
Nils Gehlenborg
IEEE computer graphics and applications, 45(5), 18-34
Mark S Keller, Eric Moerth, Thomas C Smits, Simon Warchol, Qianwen Wang, Robert Krueger, Hanspeter Pfister, Nils Gehlenborg (2025). The State of Single-Cell Atlas Data Visualization in the Biological Literature. IEEE computer graphics and applications, 45(5), 18-34. 10.1109/MCG.2025.3583979
@article{keller2025star,
author={Keller, Mark S. and Mörth, Eric and Smits, Thomas C. and Warchol, Simon and Guo, Grace and Wang, Qianwen and Krueger, Robert and Pfister, Hanspeter and Gehlenborg, Nils},
journal={IEEE Computer Graphics and Applications},
title={The State of Single-Cell Atlas Data Visualization in the Biological Literature},
year={2025},
volume={45},
number={5},
pages={18-34},
keywords={Data visualization;Biology;Phenotypes;Diseases;Bioinformatics;Surveys;Proteins;DNA;Biological tissues;Systematic literature review},
doi={10.1109/MCG.2025.3583979}
}
2024
AltGosling: Automatic Generation of Text Descriptions for Accessible Genomics Data Visualization
Thomas C Smits,
Sehi L’Yi,
Andrew P Mar,
Nils Gehlenborg
Thomas C Smits, Sehi L’Yi, Andrew P Mar, Nils Gehlenborg (2024). AltGosling: Automatic Generation of Text Descriptions for Accessible Genomics Data Visualization, Bioinformatics 40(12), btae670. 10.1093/bioinformatics/btae670
@article{smits2024altgosling,
author = {Smits, Thomas C and L’Yi, Sehi and Mar, Andrew P and Gehlenborg, Nils},
title = {AltGosling: automatic generation of text descriptions for accessible genomics data visualization},
journal = {Bioinformatics},
volume = {40},
number = {12},
pages = {btae670},
year = {2024},
month = {11},
abstract = {Biomedical visualizations are key to accessing biomedical knowledge and detecting new patterns in large datasets. Interactive visualizations are essential for biomedical data scientists and are omnipresent in data analysis software and data portals. Without appropriate descriptions, these visualizations are not accessible to all people with blindness and low vision, who often rely on screen reader accessibility technologies to access visual information on digital devices. Screen readers require descriptions to convey image content. However, many images lack informative descriptions due to unawareness and difficulty writing such descriptions. Describing complex and interactive visualizations, like genomics data visualizations, is even more challenging. Automatic generation of descriptions could be beneficial, yet current alt text generating models are limited to basic visualizations and cannot be used for genomics.We present AltGosling, an automated description generation tool focused on interactive data visualizations of genome-mapped data, created with the grammar-based genomics toolkit Gosling. The logic-based algorithm of AltGosling creates various descriptions including a tree-structured navigable panel. We co-designed AltGosling with a blind screen reader user (co-author). We show that AltGosling outperforms state-of-the-art large language models and common image-based neural networks for alt text generation of genomics data visualizations. As a first of its kind in genomic research, we lay the groundwork to increase accessibility in the field.The source code, examples, and interactive demo are accessible under the MIT License at https://github.com/gosling-lang/altgosling. The package is available at https://www.npmjs.com/package/altgosling.},
issn = {1367-4811},
doi = {10.1093/bioinformatics/btae670},
url = {https://doi.org/10.1093/bioinformatics/btae670},
eprint = {https://academic.oup.com/bioinformatics/article-pdf/40/12/btae670/60964495/btae670.pdf},
}
Explaining Unfamiliar Genomics Data Visualizations to a Blind Individual through Transitions
Thomas C Smits,
Sehi L’Yi,
Huyen N Nguyen,
Andrew P Mar,
Nils Gehlenborg
IEEE 2024 1st Workshop on Accessible Data Visualization (AccessViz)
Thomas C Smits, Sehi L’Yi, Huyen N Nguyen, Andrew P Mar, Nils Gehlenborg (2024). Explaining Unfamiliar Genomics Data Visualizations to a Blind Individual through Transitions, IEEE 2024 1st Workshop on Accessible Data Visualization (AccessViz), St Pete Beach, FL, USA, 2024, pp. 24-28, 10.1109/AccessViz64636.2024.00010
@inproceedings{smits2024transitioningcharts,
author={Smits, Thomas C. and L’Yi, Sehi and Nguyen, Huyen N. and Mar, Andrew P. and Gehlenborg, Nils},
booktitle={2024 1st Workshop on Accessible Data Visualization (AccessViz)},
title={Explaining Unfamiliar Genomics Data Visualizations to a Blind Individual through Transitions},
year={2024},
volume={},
number={},
pages={24-28},
keywords={Visualization;Conferences;Data visualization;Genomics;Bioinformatics;Accessible Visualization;Perception & Cognition;Genomics;Transitions;Charts},
doi={10.1109/AccessViz64636.2024.00010}
}
Using OpenKeyNav to Enhance the Keyboard-Accessibility of Web-based Data Visualization Tools
Lawrence Weru,
Sehi L’Yi,
Thomas C Smits,
Nils Gehlenborg
Lawrence Weru, Sehi L’Yi, Thomas C Smits, Nils Gehlenborg (2024). Using OpenKeyNav to Enhance the Keyboard-Accessibility of Web-based Data Visualization Tools (presented at IEEE VIS 2024 AccessViz Workshop). 10.31219/osf.io/3wjsa
2023
Advances and prospects for the Human BioMolecular Atlas Program (HuBMAP)
Sanjay Jain,
Liming Pei,
Jeffrey M Spraggins,
Michael Angelo,
James P. Carson,
Nils Gehlenborg,
Fiona Ginty,
Joana P. Gonçalves,
James S. Hagood,
John W. Hickey,
Neil L. Kelleher,
Louise C. Laurent,
Shin Lin,
Yiing Lin,
Huiping Liu,
Alexandra Naba,
Ernesto S. Nakayasu,
Wei-Jun Qian,
Andrea Radtke,
Paul Robson,
Brent R. Stockwell,
Raf Van de Plas,
Ioannis S. Vlachos,
Mowei Zhou,
HuBMAP Consortium,
Katy Börner,
Michael P. Snyder
Sanjay Jain, Liming Pei, Jeffrey M Spraggins, et al. Advances and prospects for the Human BioMolecular Atlas Program (HuBMAP). Nature Cell Biology 25, 1089–1100 (2023). 10.1038/s41556-023-01194-w
@article{jain2023hubmap,
title = {Advances and Prospects for the {{Human BioMolecular Atlas Program}} ({{HuBMAP}})},
author = {Jain, Sanjay and Pei, Liming and Spraggins, Jeffrey M. and Angelo, Michael and Carson, James P. and Gehlenborg, Nils and Ginty, Fiona and Gon{\c c}alves, Joana P. and Hagood, James S. and Hickey, John W. and Kelleher, Neil L. and Laurent, Louise C. and Lin, Shin and Lin, Yiing and Liu, Huiping and Naba, Alexandra and Nakayasu, Ernesto S. and Qian, Wei-Jun and Radtke, Andrea and Robson, Paul and Stockwell, Brent R. and Van De Plas, Raf and Vlachos, Ioannis S. and Zhou, Mowei and {HuBMAP Consortium} and Ahn, Kyung Jin and Allen, Jamie and Anderson, David M. and Anderton, Christopher R. and Curcio, Christine and Angelin, Alessia and Arvanitis, Constadina and Atta, Lyla and {Awosika-Olumo}, Demi and Bahmani, Amir and Bai, Huajun and Balderrama, Karol and Balzano, Leandro and Bandyopadhyay, Gautam and Bandyopadhyay, Shovik and {Bar-Joseph}, Ziv and Barnhart, Kurt and Barwinska, Daria and Becich, Michael and Becker, Laren and Becker, Winston and Bedi, Kenneth and Bendall, Sean and Benninger, Kathy and Betancur, David and Bettinger, Keith and Billings, Sunteasja and Blood, Philip and Bolin, Daniel and Border, Samuel and Bosse, Marc and Bramer, Lisa and Brewer, Maya and Brusko, Maigan and Bueckle, Andreas and Burke, Karl and {Burnum-Johnson}, Kristin and Butcher, Eugene and Butterworth, Elizabeth and Cai, Long and Calandrelli, Riccardo and Caldwell, Michael and {Campbell-Thompson}, Martha and Cao, Dongfeng and {Cao-Berg}, Ivan and Caprioli, Richard and Caraccio, Chiara and Caron, Anita and Carroll, Megan and Chadwick, Chrystal and Chen, Angela and Chen, Derek and Chen, Fei and Chen, Haoran and Chen, Jing and Chen, Li and Chen, Lu and Chiacchia, Kenneth and Cho, Sanghee and Chou, Peter and Choy, Lisa and Cisar, Cecilia and Clair, Geremy and Clarke, Laura and Clouthier, Kelly A. and Colley, Madeline E. and Conlon, Kristin and Conroy, John and Contrepois, Kevin and Corbett, Anthony and Corwin, Alex and Cotter, Daniel and Courtois, Elise and Cruz, Aaron and Csonka, Christopher and Czupil, Kimberley and Daiya, Vicky and Dale, Kali and Davanagere, Shakeel Ahamed and Dayao, Monica and De Caestecker, Mark P. and Decker, Aubrianna and Deems, Stephen and Degnan, David and Desai, Tushar and Deshpande, Vikrant and Deutsch, Gail and Devlin, Michelle and Diep, Dinh and Dodd, Carla and Donahue, Sean and Dong, Weixiu and Dos Santos Peixoto, Rafael and Duffy, Michael and Dufresne, Martin and Duong, Thu Elizabeth and Dutra, Jennifer and Eadon, Michael T. and {El-Achkar}, Tarek M. and Enninful, Archibald and Eraslan, Gokcen and Eshelman, Diane and {Espin-Perez}, Almudena and Esplin, Edward D. and Esselman, Allison and Falo, Louis D. and Falo, Louis and Fan, Jean and Fan, Rong and Farrow, Melissa A. and Farzad, Negin and Favaro, Patricia and Fermin, Jamie and Filiz, Ferda and Filus, Shane and Fisch, Kathleen and Fisher, Eyal and Fisher, Stephen and Flowers, Katelyn and Flynn, William F. and Fogo, Agnes B. and Fu, Dongtao and Fulcher, James and Fung, Anthony and Furst, Derek and Gallant, Michael and Gao, Fu and Gao, Yu and Gaulton, Kyle and Gaut, Joseph P. and Gee, James and Ghag, Reetika R. and Ghazanfar, Shila and Ghose, Soumya and Gisch, Debora and Gold, Ilan and Gondalia, Aashay and Gorman, Brittney and Greenleaf, William and Greenwald, Noah and Gregory, Brian and Guo, Rong and Gupta, Rajat and Hakimian, Hunter and Haltom, Jeff and Halushka, Marc and Han, Kyu Sang and Hanson, Casey and Harbury, Pehr and Hardi, Josef and Harlan, Linda and Harris, Raymond C. and Hartman, Austin and Heidari, Elyas and Helfer, Jesse and Helminiak, David and Hemberg, Martin and Henning, Nathaniel and Herr, Bruce W. and Ho, Jonhan and {Holden-Wiltse}, Jeanne and Hong, Seung-Hyun and Hong, Young-Kwon and Honick, Brendan and Hood, Greg and Hu, Po and Hu, Qiwen and Huang, Molly and Huyck, Heidie and Imtiaz, Tamjid and Isberg, Olof Gerdur and Itkin, Maxim and Jackson, Dana and Jacobs, Marni and Jain, Yashvardhan and Jewell, David and Jiang, Lihua and Jiang, Zhenghui G. and Johnston, Sarah and Joshi, Pujan and Ju, Yingnan and Judd, Audra and Kagel, Adam and Kahn, Ari and Kalavros, Nikolaos and Kalhor, Kian and Karagkouni, Dimitra and Karathanos, Thomas and Karunamurthy, Arivarasan and Katari, Suhas and Kates, Heather and Kaushal, Madhurima and Keener, Nicholas and Keller, Mark and Kenney, Mariah and Kern, Colin and Kharchenko, Peter and Kim, Junhyong and Kingsford, Carl and Kirwan, Jessica and Kiselev, Vladimir and Kishi, Jocelyn and Kitata, Reta Birhanu and Knoten, Amanda and Kollar, Charles and Krishnamoorthy, Praveen and Kruse, Angela R. S. and Da, Kuang and Kundaje, Anshul and Kutschera, Eric and Kwon, Yumi and Lake, Blue B. and Lancaster, Samuel and Langlieb, Jonah and Lardenoije, Roy and Laronda, Monica and Laskin, Julia and Lau, Ken and Lee, Hayan and Lee, Maria and Lee, Mejeong and Strekalova, Yulia Levites and Li, Dongshunyi and Li, Jennifer and Li, Jilong and Li, Xiangtang and Li, Zhi and Liao, Yen-Chen and Liaw, Tiffany and Lin, Pei and Lin, Yulieh and Lindsay, Scott and Liu, Chunjie and Liu, Yang and Liu, Yuan and Lott, Marie and Lotz, Martin and Lowery, Lisa and Lu, Peiran and Lu, Xinyue and Lucarelli, Nicholas and Lun, Xiaokang and Luo, Zhifei and Ma, Jian and Macosko, Evan and Mahajan, Mayank and Maier, Libby and Makowski, Danika and Malek, Morad and Manthey, David and Manz, Trevor and Margulies, Kenneth and Marioni, John and Martindale, Matthew and Mason, Cayla and Mathews, Clayton and Maye, Peter and McCallum, Chuck and McDonough, Elizabeth and McDonough, Liz and Mcdowell, Hannah and Meads, Morgan and {Medina-Serpas}, Miguel and Ferreira, Ricardo Melo and Messinger, Jeffrey and Metis, Kay and Migas, Lukasz G. and Miller, Brendan and Mimar, Sayat and Minor, Brittany and Misra, Ravi and Missarova, Alsu and Mistretta, Christopher and Moens, Roger and Moerth, Eric and Moffitt, Jeffrey and Molla, Gesmira and Monroe, Matthew and Monte, Emma and Morgan, Mike and Muraro, Daniele and Murphy, Bob and Murray, Evan and Musen, Mark A. and Naglah, Ahmed and Nasamran, Chanond and Neelakantan, Taruna and Nevins, Stephanie and Nguyen, Hieu and Nguyen, Nam and Nguyen, Tram and Nguyen, Tri and Nigra, Deb and Nofal, Michel and Nolan, Garry and Nwanne, Gerald and O'Connor, Martin and Okuda, Kenichi and Olmer, Merissa and O'Neill, Kathleen and Otaluka, Nancy and Pang, Minxing and Parast, Mana and {Pasa-Tolic}, Ljiljana and Paten, Benedict and Patterson, Nathan Heath and Peng, Ting and Phillips, Gesina and Pichavant, Mina and Piehowski, Paul and Pilner, Hannah and Pingry, Ellie and {Pita-Juarez}, Yered and Plevritis, Sylvia and Ploumakis, Athanasios and Pouch, Alison and Pryhuber, Gloria and Puerto, Juan and Qaurooni, Danial and Qin, Ling and Quardokus, Ellen M. and Rajbhandari, Presha and {Rakow-Penner}, Rebecca and Ramasamy, Ramalakshmi and Read, David and Record, Elizabeth G. and Reeves, David and Ricarte, Allyson and {Rodr{\'i}guez-Soto}, Ana and Ropelewski, Alexander and Rosario, Jean and Roselkis, Morla-Adames and Rowe, David and Roy, Tarun Kanti and Ruffalo, Matt and Ruschman, Nancy and Sabo, Angela and Sachdev, Nina and Saka, Sinem and Salamon, Diane and Sarder, Pinaki and Sasaki, Hiroshi and Satija, Rahul and Saunders, Diane and Sawka, Riley and Schey, Kevin and Schlehlein, Heidi and Scholten, David and Schultz, Sarah and Schwartz, Lauren and Schwenk, Melissa and Scibek, Robin and Segre, Ayellet and Serrata, Matthew and Shands, Walter and Shen, Xiaotao and Shendure, Jay and Shephard, Holly and Shi, Lingyan and Shi, Tujin and Shin, Dong-Guk and Shirey, Bill and Sibilla, Max and Silber, Michal and Silverstein, Jonathan and Simmel, Derek and Simmons, Alan and Singhal, Dhruv and Sivajothi, Santhosh and Smits, Thomas and Soncin, Francesca and Song, Qi and Stanley, Valentina and Stuart, Tim and Su, Hanquan and Su, Pei and Sun, Xin and Surrette, Christine and Swahn, Hannah and Tan, Kai and Teichmann, Sarah and Tejomay, Abhiroop and Tellides, George and Thomas, Kathleen and Thomas, Tracey and Thompson, Marissa and Tian, Hua and Tideman, Leonoor and Trapnell, Cole and Tsai, Albert G. and Tsai, Chia-Feng and Tsai, Leo and Tsui, Elizabeth and Tsui, Tina and Tung, Jason and Turner, Morgan and Uranic, Jackie and Vaishnav, Eeshit Dhaval and Varra, Sricharan Reddy and Vaskivskyi, Vasyl and Velickovic, Dusan and Velickovic, Marija and Verheyden, Jamie and Waldrip, Jessica and Wallace, Douglas and Wan, Xueyi and Wang, Allen and Wang, Fusheng and Wang, Meng and Wang, Shuoshuo and Wang, Xuefei and Wasserfall, Clive and Wayne, Leonard and Webber, James and Weber, Griffin M. and Wei, Bei and Wei, Jian-Jun and Weimer, Annika and Welling, Joel and Wen, Xingzhao and Wen, Zishen and Williams, MacKenzie and Winfree, Seth and Winograd, Nicholas and Woodard, Abashai and Wright, Devin and Wu, Fan and Wu, Pei-Hsun and Wu, Qiuyang and Wu, Xiaodong and Xing, Yi and Xu, Tianyang and Yang, Manxi and Yang, Mingyu and Yap, Joseph and Ye, Dong Hye and Yin, Peng and Yuan, Zhou and Yun, Chi and Zahraei, Ali and Zemaitis, Kevin and Zhang, Bo and Zhang, Caibin and Zhang, Chenyu and Zhang, Chi and Zhang, Kun and Zhang, Shiping and Zhang, Ted and Zhang, Yida and Zhao, Bingqing and Zhao, Wenxin and Zheng, Jia Wen and Zhong, Sheng and Zhu, Bokai and Zhu, Chenchen and Zhu, Diming and Zhu, Quan and Zhu, Ying and B{\"o}rner, Katy and Snyder, Michael P.},
year = 2023,
month = aug,
journal = {Nature Cell Biology},
volume = {25},
number = {8},
pages = {1089--1100},
issn = {1465-7392, 1476-4679},
doi = {10.1038/s41556-023-01194-w},
url = {https://doi.org/10.1038/s41556-023-01194-w},
}
Digital Accessibility of Life Science Data Portals and Journal Websites
Sehi L’Yi,
Thomas C Smits,
Alexander Lex,
Nils Gehlenborg
Sehi L’Yi, Thomas C Smits, Alexander Lex, Nils Gehlenborg (2023). Digital Accessibility of Life Science Data Portals and Journal Websites. OSF Preprints. 10.31219/osf.io/5v98j
2022
Somatic Changes Prior to the Development of Hyperdiploidy Expose Mutation Accumulation Rate and Activated Processes in Multiple Myeloma
Thomas C Smits,
Anil Aktas Samur,
Romain Lannes,
Mariateresa Fulciniti,
Masood Shammas,
Jill Corre,
Kenneth Anderson,
Giovanni Parmigiani,
Hervé Avet-Loiseau,
Nikhil Munshi,
Mehmet Samur
Blood, 140(Supplement 1), 168837
American Society of Hematology Abstract Achievement Award
Thomas C Smits, Anil Aktas Samur, Romain Lannes, Mariateresa Fulciniti, Masood Shammas, Jill Corre, Kenneth Anderson, Giovanni Parmigiani, Hervé Avet-Loiseau, Nikhil Munshi, Mehmet Samur (2022, December). Somatic Changes Prior to the Development of Hyperdiploidy Expose Mutation Accumulation Rate and Activated Processes in Multiple Myeloma. 64th ASH Annual Meeting and Exposition, New Orleans, LA. 10.1182/blood-2022-168837
@article{smits2022hmm,
author = {Smits, Thomas C. and Aktas-Samur, Anil and Lannes, Romain and Fulciniti, Mariateresa and Shammas, Masood A. and Corre, Jill and Parmigiani, Giovanni and Avet-Loiseau, Herve and Munshi, Nikhil C and Samur, Mehmet K.},
title = {Somatic Changes Prior to the Development of Hyperdiploidy Expose Mutation Accumulation Rate and Activated Processes in Multiple Myeloma},
journal = {Blood},
volume = {140},
number = {Supplement 1},
pages = {7062-7063},
year = {2022},
month = {11},
issn = {0006-4971},
doi = {10.1182/blood-2022-168837},
url = {https://doi.org/10.1182/blood-2022-168837},
}
PHF19 Inhibits Multiple Myeloma Cell Response to Immunotherapy Via Promoting Immunosuppressive Microenvironment
Tengteng Yu,
Mu Hao,
Hailin Chen,
Kenneth Wen,
Tingjian Wang,
Thomas Smits,
Mehmet Samur,
Eugenio Morelli,
Lijie Xing,
Liang Lin,
Jun Qi,
Gang An,
Nikhil Munshi,
Yu-Tzu Tai,
Lugui Qiu,
Kenneth Anderson
Blood, 140(Supplement 1), 159137
American Society of Hematology Abstract Achievement Award
Tengteng Yu, Mu Hao, Hailin Chen, Kenneth Wen, Tingjian Wang, Thomas Smits, Mehmet Samur, Eugenio Morelli, Lijie Xing, Liang Lin, Jun Qi, Gang An, Nikhil Munshi, Yu-Tzu Tai, Lugui Qiu, Kenneth Anderson (2022, December). PHF19 Inhibits Multiple Myeloma Cell Response to Immunotherapy Via Promoting Immunosuppressive Microenvironment. 64th ASH Annual Meeting and Exposition, New Orleans, LA. 10.1182/blood-2022-159137
@article{yu2022phf19,
author = {Yu, Tengteng and Hao, Mu and Chen, Hailin and Wen, Kenneth and Wang, Tingjian and Smits, Thomas C.M and Samur, Mehmet K. and Morelli, Eugenio and Xing, Lijie and Lin, Liang and Qi, Jun and An, Gang and Munshi, Nikhil C and Tai, Yu-Tzu and Qiu, Lugui and Anderson, Kenneth C.},
title = {PHF19 Inhibits Multiple Myeloma Cell Response to Immunotherapy Via Promoting Immunosuppressive Microenvironment},
journal = {Blood},
volume = {140},
number = {Supplement 1},
pages = {854-855},
year = {2022},
month = {11},
issn = {0006-4971},
doi = {10.1182/blood-2022-159137},
url = {https://doi.org/10.1182/blood-2022-159137},
}
OAB-017: Mutations accumulated before and after hyperdiploidy reveal timing and impact of chromosomal gains on multiple myeloma
Thomas C Smits,
Anil Aktas Samur,
Romain Lannes,
Mariateresa Fulciniti,
Masood Shammas,
Jill Corre,
Kenneth Anderson,
Giovanni Parmigiani,
Hervé Avet-Loiseau,
Nikhil Munshi,
Mehmet Samur
Clinical Lymphoma, Myeloma and Leukemia, Volume 22, S10 - S11
International Myeloma Society Young Investigator Award
Thomas C Smits, Anil Aktas Samur, Romain Lannes, Mariateresa Fulciniti, Masood Shammas, Jill Corre, Kenneth Anderson, Giovanni Parmigiani, Hervé Avet-Loiseau, Nikhil Munshi, Mehmet Samur (2022, August). OAB-017: Mutations accumulated before and after hyperdiploidy reveal timing and impact of chromosomal gains on multiple myeloma. 19th International Myeloma Society Annual Meeting, Los Angeles, CA. 10.1016/S2152-2650(22)00290-7
OAB-031: PHF19 promotes multiple myeloma cell resistant to daratumumab/isatuximab via upregulation in immunosuppressive microenvironment and reduced CD38 target expression
Tengteng Yu,
Hailin Chen,
Kenneth Wen,
Tingjian Wang,
Phillip Hsieh,
Thomas C Smits,
Mehmet Samur,
Lijie Xing,
Liang Lin,
Mu Hao,
Lugui Qiu,
Yu-Tzu Tai,
Kenneth Anderson
Clinical Lymphoma, Myeloma and Leukemia, Volume 22, S18 - S19
Tengteng Yu, Hailin Chen, Kenneth Wen, Tingjian Wang, Phillip Hsieh, Thomas C Smits, Mehmet Samur, Lijie Xing, Liang Lin, Mu Hao, Lugui Qiu, Yu-Tzu Tai, Kenneth Anderson (2022, August). OAB-031: PHF19 promotes multiple myeloma cell resistant to daratumumab/isatuximab via upregulation in immunosuppressive microenvironment and reduced CD38 target expression. 19th International Myeloma Society Annual Meeting, Los Angeles, CA. 10.1016/S2152-2650(22)00304-4
OAB-013: Universal loss of BCL7A allows release of its binding partner IRF4 inducing its transcriptional activity promoting MM cell growth
Chandraditya Chakraborty,
Srikanth Talluri,
Eugenio Morelli,
Sanika Derebail,
Yan Xu,
Charles Epstein,
Thomas Smits,
Moritz Binder,
Kenneth Anderson,
Masood Shammas,
Mehmet Samur,
Mariateresa Fulciniti,
Nikhil Munshi
Clinical Lymphoma, Myeloma and Leukemia, Volume 22, S8
Chandraditya Chakraborty, Srikanth Talluri, Eugenio Morelli, Sanika Derebail, Yan Xu, Charles Epstein, Thomas Smits, Moritz Binder, Kenneth Anderson, Masood Shammas, Mehmet Samur, Mariateresa Fulciniti, Nikhil Munshi (2022, August). OAB-013: Universal loss of BCL7A allows release of its binding partner IRF4 inducing its transcriptional activity promoting MM cell growth. 19th International Myeloma Society Annual Meeting, Los Angeles, CA. 10.1016/S2152-2650(22)00286-5
Additional
Accessibility in Grammar-Based Genomics Visualization Language Gosling through Automatic Generation of Text Descriptions
Thomas C Smits,
Sehi L’Yi,
Nils Gehlenborg
HMS Master’s Programs Research Symposium
Thomas C Smits, Sehi L’Yi, Nils Gehlenborg (2023, March). Accessibility in Grammar-Based Genomics Visualization Language Gosling through Automatic Generation of Text Descriptions. 9th Annual HMS Master’s Programs Research Symposium, Boston, MA.
Workspaces in Portal: Data Linking and Templates in Jupyter Lab
Thomas C Smits,
Nikolay Akhmetov,
Lisa Choy,
John Conroy,
Mark Keller,
Tiffany Liaw,
Juan Puerto,
Samson Toor,
Morgan L Turner,
Philip Blood,
Nils Gehlenborg
HuBMAP Demo Day
Thomas C Smits, Nikolay Akhmetov, Lisa Choy, John Conroy, Mark Keller, Tiffany Liaw, Juan Puerto, Samson Toor, Morgan L Turner, Philip Blood, Nils Gehlenborg (2023, December). Workspaces in Portal: Data Linking and Templates in Jupyter Lab. HuBMAP. HuBMAP Demo Day, remote.
Workspaces in Portal (in progress): templates allow for easy cell type composition exploration
Thomas C Smits,
HuBMAP Harvard HIVE-TC,
HiDIVE Lab
HuBMAP Annual Meeting
Thomas C Smits, HuBMAP Harvard HIVE-TC, HiDIVE Lab (2023, May). Workspaces in Portal (in progress): templates allow for easy cell type composition exploration. HuBMAP Annual Meeting, Nashville, TN.


 Runner-Up Abstract Award at ISMB BioVis 2025


